MillerBlaker

MillerBlaker is a 200-person company that specializes in the commodities market.


Project Overview

Worked with company owners and project managers to develop a new program to run their business more efficiently.

  • Clock Icon
    Challenge
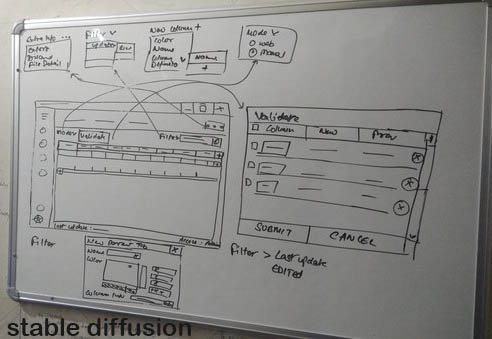
    I was hired to increase production. I achieved this by studying WIP and by implemeting new agile software systems.
  • Graph Icon
    Goals

    Eliminate repetitive tasks and multiple data entry steps.

    Create a way to determine whether a task has been completed.

    Develop a standard naming and labeling convention to speed up production, which allowed for tracking in ERP and SAP procurement system.

  • Generic placeholder image
    Team

    Design Lead (me)

    PM manager

    Three developers

    Comptroller

    Purchasing manager

  • Generic placeholder image
    Milestones

    Successfully implemented agile software, which sped up production by 25%.

    Worked with purchasing and product management to design a user interface for an SAP database that shows purchase order data and contact information for 50 users.

    Developed and designed dashboards for owners to view projects. It has a bar graph on the left showing progress and a pie chart on the right showing profit and loss.

Design Process


Personas

The personas were used to analyze preferences and demographic data, which allowed for a simple definition of users' archetypes.

Placeholder image
Placeholder image
Placeholder image


Ideation


After ideating & gathering feedback from stakeholders, I created a design of the system.

Paper version


Design Iterations


Milestone meetings with the PM and CEO allowed for quick design iterations, which were reviewed and updated.

Placeholder image 

User Testing


Junior project managers were used as testers. They validated system functions and found errors in a constant iterative process.

Placeholder image 


Interfaces 


LOG IN 
INFO
PO's
VIEW


VIEWER
DEALS
ROI
COST


DesignOps


Worked with developers to share and understand the design for development.


White Board


  • Role Icon
    My Role

    Information Architect

    UX Researcher

    UI/UX Designer

    Design Systems

    Business Strategies

    Developer

    User Training

    Competitive Usability Testing

    User Persona

    User Flow

    Wireframing and Prototyping

  • Development Icon
    Development

    Responsive Design

    Crystal Reports

    Chart and Graph Design

    Data Taxonomy

    XML Metadata

    Enterprise Applications

    SAS development

    Google analytics

    IOS vs Android

    Plan Requirements

    Visual Basic ,VBA


Retrospective


Data displayed properly will enhance the users value
Define the end goal and work towards it incrementally

Test your data queries with each software update